
Working with large data sets is increasingly important in a wide range of disciplines. As a result, student demand for courses related to data science is growing on many ACM campuses, filling up available classes and stretching the resources of math and statistics departments.
How to meet this challenge?
That question drew math, computer science, and statistics faculty from seven colleges to the Harnessing Big Data workshop in June 2015, funded by an ACM Faculty Career Enhancement (FaCE) grant.
In their discussions, the faculty took stock of data science curricula at ACM colleges and considered ways to pool resources and expand opportunities in this key area for students across the consortium.
Sharing faculty strengths across campuses
Three professors — Shonda Kuiper (Grinnell College), Laura Chihara (Carleton College), and Adam Loy (Lawrence University) — applied for and received a FaCE grant to help put one of the ideas from the workshop into action.
Their project, Making Decisions with Data, focused on creating tutorials to help students learn how to use R, a popular computer language for statistical analysis and graphics, and the open-source software R Studio. The tutorials enable students to manipulate “real world” data sets using R to analyze data and create visualizations.
Visit the Stat2Labs website created by Professor Shonda Kuiper for R Tutorials and other materials for teaching data science!
Throughout the summer of 2016, Kuiper, Chihara, and Loy developed tutorials in their individual areas of expertise, trading them back and forth for review and to learn from each other’s work. They also put together companion case studies that explored each lesson in greater depth. By collaborating, they covered a wide range of topics that none of them could have taken on alone.
After uploading their newly-created set of R tutorials in data science to Kuiper’s Stat2Labs website, a repository of project-based curricular materials for teaching data science, they rolled the tutorials out in their fall classes.
Hands-on approach resonates with students
The tutorials proved to be versatile, as the faculty used them in courses ranging from introductory statistics to a 300-level statistical modeling course. They’ve also been a hit with students, who quickly get a taste of what data science can do.
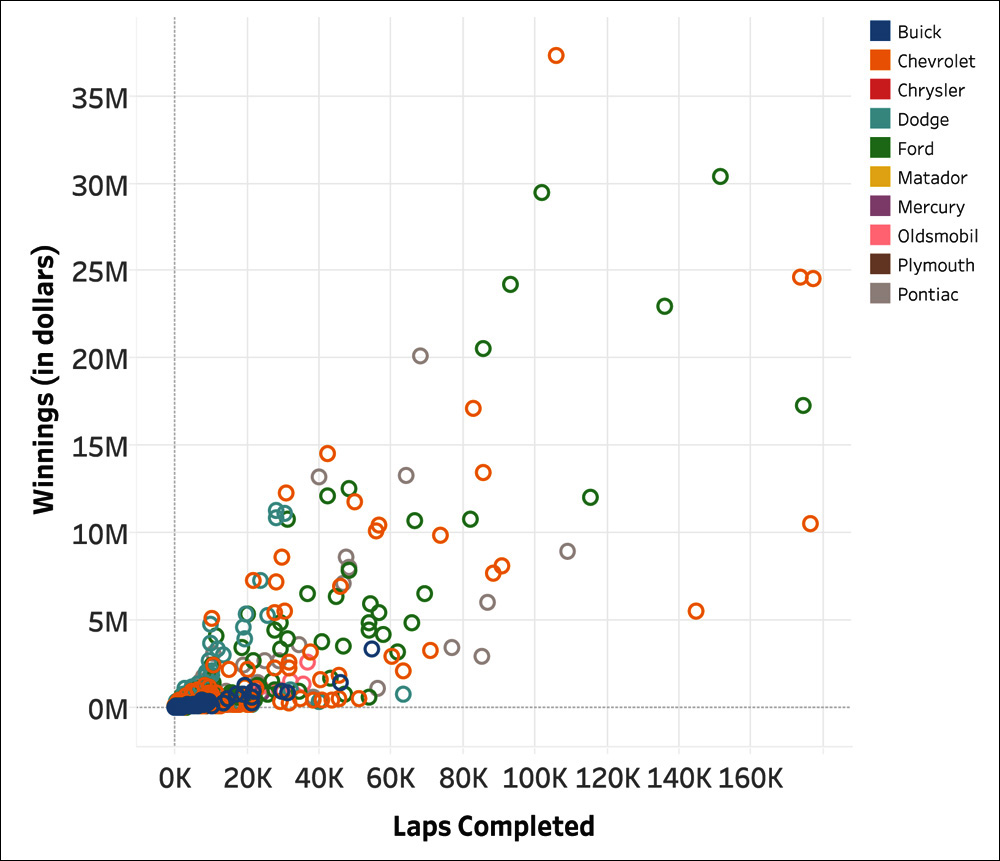
In a first-year seminar, Kuiper’s students used R Studio to generate graphics for projects such as plotting the spatial spread of cholera in a city to pinpoint the origin of an outbreak of the disease and analyzing data on the results of car races to find out which makes and models are most likely to win.
“One of the things we’re really trying to focus on is using data science to tell stories about data,” she said. “That was my approach with this class — what does the data really tell you, and how can you write about that effectively?”
“Data is available in every field now and people need to know how to properly think about it,” Kuiper noted. “It’s really easy to assume that data is straightforward, but data is rarely straightforward. I think what statistics can bring is thinking about the data appropriately.”
Applying data science skills across disciplines
With demand for data science instruction coming from students in a wide range of majors, such as economics, psychology, biology, chemistry, and political science, the tutorials provide a starting point for working with large data sets that’s accessible for students without a deep background in math. Students gain practical skills they can use for problem-solving in their own disciplines.
Loy offered the tutorials to his upper-level students as a self-guided way to deepen their grasp of R programming. For his introductory statistics class last fall, he took a more blended approach to his teaching than usual, having his students cover basic material outside of class and using the project’s tutorials for hands-on labs in the classroom.
“I’ve tried before to use videos, but those were not as engaging for students as working with the data-driven problems and tutorials,” he said. “Students were more confident in their work and many were intrigued by what they could do using R programming.”
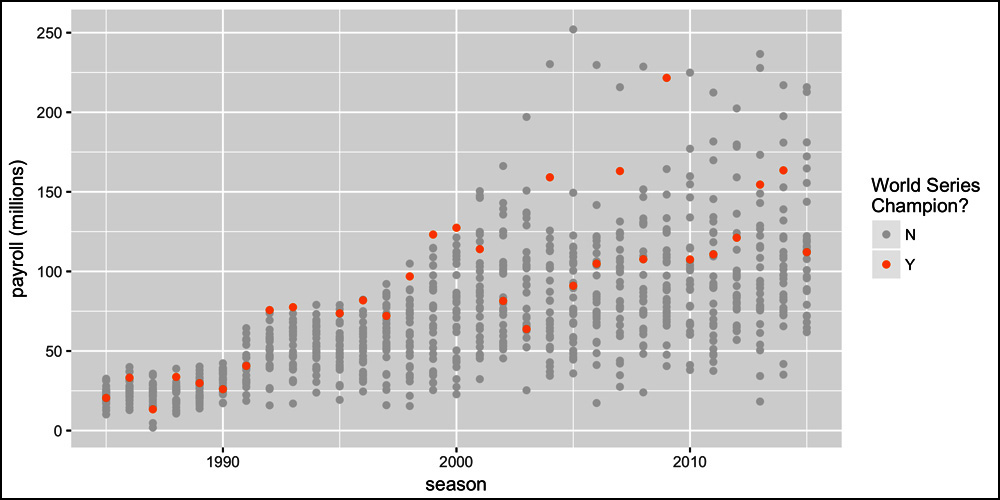 In a visualization created in one of professor Adam Loy’s classes, the dotplot reveals that while many World Series winning major league baseball teams in the past 30 years have had high payrolls, there have been plenty of winners with moderate payrolls. There does, however, seem to be some indication that teams need to spend some money to win the World Series, as very low payroll teams are not winning the championship.
Continuing the collaboration
Both Loy and Kuiper are using national conferences to increase awareness of the tutorials and case studies. Loy has submitted a proposal to present a workshop at the US Conference on Teaching Statistics in May and Kuiper is set to give a poster presentation at the American Statistical Association conference in August.
“Now that we’ve started this, I have about five more tutorials I would love to create and I think would fit really well,” said Kuiper, who had students assist her in designing tutorials last summer and hopes to find funding to continue the work. “That’s what was nice about the FaCE grant — it gave me time and space to focus on the tutorials, and I think the same thing was true for Adam and Laura.”
“This project made me think more carefully about some of the data scientific topics I’ve wanted to incorporate into statistics classes and how I’d actually do that,” said Loy, who plans to refine and add more tutorials to the site, as well. “It also helped me foster this collaboration with Shonda and Laura. If you’re the only statistician [on a campus] or just one of a very small handful, it really helps to open up these networks. It will be interesting to see what other modes of sharing strengths we can come up with.”
Links:
- Faculty Career Enhancement Program (FaCE)
- FaCE-funded projects: Making Decisions with Data and Harnessing Big Data
- Stat2Labs website
- R Tutorials in Data Science created by Professors Chihara, Kuiper, and Loy
Making Decisions with data was supported by a grant from The Teagle Foundation, as well as from the FaCE program.
The Faculty Career Enhancement Program (FaCE) is supported by a generous grant from The Andrew W. Mellon Foundation.